


Nonfiction
eBook
Details
PUBLISHED
Made available through hoopla
DESCRIPTION
1 online resource
ISBN/ISSN
LANGUAGE
NOTES
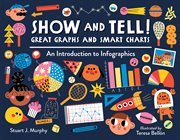
A visual-learning expert races up the charts and graphs math success with kid-friendly content sure to help with homework. Want to find the most popular meal in the cafeteria? Compare town sports enrollments? Or maybe you just want to know who burps the most in your family! Learn what line graphs, bar graphs, pie charts, and pictographs are and how and when to use them to represent data. Each project shows how to build a chart or graph and ties it all together with a creative infographic that really puts the A in STEAM (Science, Technology, Engineering, ARTS, and Mathematics). Whether used as an introductory aid or to underscore previous knowledge, the book prepares today's visually savvy children to succeed in school and life by analyzing the world around them
Mode of access: World Wide Web